
Business Intelligence (BI) software drives smarter decision-making across industries in 2026. From dashboards and data visualization to predictive analytics and automated reporting, these tools help businesses unlock actionable insights from complex data.
In today’s data-driven world, over 91% of companies say BI tools are essential for improving efficiency, competitiveness, and strategic planning. US companies like Amazon, Netflix, and Walmart rely on robust BI platforms like Power BI, Tableau, and Looker to analyze trends and forecast outcomes.
BI solutions are replacing traditional spreadsheets due to their real-time analytics, automation, and integration capabilities. Businesses choose BI tools based on data volume, collaboration needs, and industry-specific use cases.
In short, here are the best business intelligence software at this moment:
- IBM Cognos Analytics – Best for AI-powered data insights. Offers advanced reporting, smart visualizations, and natural language queries, helping businesses make fast, informed decisions.
- Zoho Analytics – Best self-service BI for small to midsize businesses. Enables data blending, easy dashboard creation, and collaborative sharing without technical complexity.
- SAS Business Intelligence – Best for advanced analytics and enterprise use. Known for robust data mining and statistical analysis tools tailored for expert users.
- Domo – Best for real-time dashboards and cloud integration. Combines multiple data sources into one platform with powerful mobile access and team collaboration features.
- Yellowfin BI – Best for data storytelling and collaboration. Offers automated insight discovery and clean dashboards designed for non-technical users.
Want a ranked overview of the top 15 business intelligence software used in 2026, covering everything from enterprise-level dashboards to small business-friendly tools? Let’s dive in!
Top 15 Best Business Intelligence Software in 2026
- Microsoft Power BI – Comprehensive and User-Friendly BI Solution
- Tableau – Advanced Data Visualization for In-Depth Analysis
- Qlik Sense – Associative Data Model for Enhanced Insights
- Looker – Data Exploration with a Modern Approach
- Sisense – End-to-End BI Platform with Embedded Analytic
- SAP BusinessObjects – Enterprise-Grade BI for Comprehensive Reporting
- IBM Cognos Analytics – AI-Driven BI for Informed Decision-Making
- Zoho Analytics – Affordable BI for Small to Medium Businesses
- Oracle Analytics Cloud – Scalable Cloud-Based BI Solution
- SAS Business Intelligence – Advanced Analytics for Data-Driven Decisions
- Domo – Cloud-Based BI for Real-Time Data Insights
- MicroStrategy – High-Performance BI with Enterprise-Grade Scalability
- Yellowfin BI – Integrated BI with Strong Collaboration Tools
- TIBCO Spotfire – Smart Analytics with Predictive Power
- ThoughtSpot – Search-Driven Analytics for Instant Insights
Before You Start…
Choosing the right business intelligence software is critical to making informed, data-backed decisions. With so many options available, it’s important to select a tool that matches your business needs whether that’s powerful data visualization, seamless integration, or affordability.
“Modern BI software doesn’t just show you the data it tells you what to do with it,” says Laura Jensen, Data Strategy Consultant.
Questions to Ask When Choosing the Right BI Software for Your Business:
- What kind of data sources does the software support?
- Does it provide real-time analytics and reporting?
- Can non-technical users operate the platform easily?
- How does it integrate with existing tools like CRMs or ERPs?
- Is the solution scalable as your data grows?
We’ve considered all these factors during our evaluation. Now, it’s time to explore the top tools available to help your business turn data into decisions.
How This Top 15 List Was Created
We reviewed dozens of BI platforms and ranked them based on functionality, ease of use, cost, scalability, and user feedback. Our team spent 70 hours testing dashboards, querying capabilities, and integration features. We also gathered real-user reviews to assess long-term satisfaction and support.
Our list includes BI tools suitable for small startups, mid-sized companies, and large enterprises. Whether you need a low-cost solution or a full-featured enterprise suite, there’s something here for every business type.
Differences in Pricing and Pricing Models
Pricing is a major factor when choosing a BI solution, but comparisons can be tricky due to different models some charge by users, others by data volume, and some by features.
Price Comparison for Small Businesses:
For smaller companies, Zoho Analytics, Mode, and GoodData offer affordable plans with solid features. Power BI also stands out for combining enterprise capabilities with cost-effectiveness.
Price Comparison for Medium to Large Enterprises:
Large enterprises may lean toward robust, scalable platforms like Tableau, Oracle Analytics Cloud, or SAP BusinessObjects, which come at a higher price point but offer deeper analytics, AI features, and enterprise-grade integrations.
Want to explore which BI tool fits your business needs best? Let’s break down each of the top 15 business intelligence software solutions in 2025!
#1 – Microsoft Power BI – Comprehensive and User-Friendly BI Solution
Microsoft Power BI is a powerful business intelligence tool known for its robust data visualization capabilities and seamless integration with other Microsoft products, making it one of the top choices for organizations looking to optimize their data analysis and reporting processes. It is particularly effective for businesses already within the Microsoft ecosystem, offering an intuitive platform that simplifies creating, sharing, and collaborating on interactive dashboards and reports. Power BI provides users with a comprehensive suite of features that help transform raw data into actionable insights in a user-friendly environment.
Review
Power BI offers an intuitive interface, allowing users to create interactive dashboards and reports with ease. Its integration with Excel and Azure services makes it a preferred choice for organizations already within the Microsoft ecosystem. Power BI also offers cloud-based solutions that make collaboration easier and ensure that teams across locations can access the data. The software is scalable, accommodating the needs of small businesses as well as large enterprises. With its rich visualization options and real-time data capabilities, Microsoft Power BI remains one of the top BI tools on the market today.
Features of Microsoft Power BI
- Interactive Dashboards: Create real-time dashboards with drag-and-drop functionality that simplify the process of presenting data insights visually.
- Data Connectivity: Connects seamlessly to various data sources including Excel, SQL Server, Azure, and cloud-based services.
- Custom Visualizations: Offers a library of custom visuals, allowing businesses to enhance their data representation.
- Collaboration Tools: Easily share reports and dashboards within teams using integrations with Microsoft Teams and other Microsoft 365 products.
- Mobile Access: Access your reports and dashboards on-the-go with mobile apps for iOS and Android, making it easier for teams to stay updated wherever they are.
Final Verdict
Microsoft Power BI stands out for its user-friendly interface, deep integration with Microsoft tools, and powerful analytics capabilities. It is an excellent solution for businesses of all sizes seeking a comprehensive and scalable BI solution. Power BI’s features make it ideal for businesses looking for strong data visualization tools combined with seamless integration into the Microsoft ecosystem.
Pros of Microsoft Power BI
- Seamless integration with other Microsoft products
- Affordable pricing with a free tier available
- Extensive data visualization options for better insights
- Strong community support and resources
- Cloud-based, ensuring real-time data access and collaboration
Cons of Microsoft Power BI
- Limited functionality in the free version
- Steeper learning curve for advanced features
- More advanced functionality may require a Power BI Pro license
#2 – Tableau – Advanced Data Visualization for In-Depth Analysis
Tableau is renowned for its ability to provide advanced data visualization tools that help transform complex data sets into easily interpretable insights. It excels in creating interactive and aesthetically engaging dashboards, allowing users to dive deep into their data without needing advanced coding knowledge. Whether you are exploring trends, comparing performance, or uncovering hidden insights, Tableau offers an intuitive drag-and-drop interface that makes data analysis accessible for business users and analysts alike. Tableau’s emphasis on high-quality visuals and flexible dashboards makes it a popular choice for organizations seeking to explore their data in greater depth.
Review
Tableau excels in transforming complex data sets into comprehensible visualizations. Its drag-and-drop interface allows users to build dashboards without extensive coding knowledge, making data analysis more accessible. The software’s powerful analytics capabilities include the ability to visualize big data and perform deep dives into your organization’s data. Tableau is favored by companies that require in-depth analysis, as it allows users to go beyond surface-level reporting to uncover hidden patterns. It also offers real-time analytics, allowing organizations to make decisions based on the most current data available.
Features of Tableau
- Data Blending: Easily combine data from multiple sources to create a comprehensive view of your business’s data.
- Real-Time Analytics: Monitor data in real-time, ensuring you can make timely and informed decisions.
- Custom Dashboards: Build personalized dashboards tailored to meet your business-specific needs.
- Collaboration: Share insights and dashboards with team members, enabling collaborative decision-making.
- Mobile Support: Interact with your dashboards on mobile devices, ensuring you can analyze data anytime, anywhere.
Final Verdict
Tableau is ideal for organizations that prioritize advanced data visualization and require tools to analyze large and complex data sets effectively. Its extensive features and customization options make it a powerful tool for those needing to make sense of intricate data for strategic planning.
Pros of Tableau
- Exceptional data visualization capabilities
- Intuitive interface for non-technical users
- Strong community and support resources
- Extensive integration with third-party tools
- Advanced analytics and reporting options
Cons of Tableau
- Higher cost compared to some competitors
- Requires training and experience to utilize advanced features effectively
- Limited in the free version, requiring a paid subscription for full functionality
#3 – Qlik Sense – Associative Data Model for Enhanced Insights
Qlik Sense offers a unique associative data model that empowers users to explore data relationships dynamically, uncovering hidden insights that would otherwise be missed in traditional reporting models. Its self-service capabilities allow users to create personalized reports and dashboards without needing to rely on IT support. With Qlik Sense, businesses can make data-driven decisions more effectively by providing users with the flexibility to explore data across multiple dimensions. Its powerful analytics engine supports both small businesses and large enterprises, offering a solution that encourages data discovery and promotes more interactive data exploration.
Review
Qlik Sense’s associative model enables users to explore data without predefined queries, fostering a more intuitive data exploration experience. Its self-service capabilities empower users to generate reports and dashboards independently, reducing the reliance on IT teams for data analysis. Qlik Sense’s visualizations are dynamic and customizable, and the platform also supports collaborative sharing of insights and real-time data analysis. Its flexibility makes it suitable for businesses of varying sizes and industries, especially those seeking to dig deeper into their data for actionable insights.
Features of Qlik Sense
- Associative Data Engine: Explore data relationships dynamically without being constrained by predefined data models.
- Self-Service Analytics: Empower users to create reports and dashboards on their own without IT support.
- Smart Visualizations: Automatically suggests the most suitable visual representation for your data.
- Collaboration Tools: Share insights and collaborate in real-time across teams within the platform.
- Mobile Compatibility: Access and interact with analytics on mobile devices, ensuring that insights are available at any time.
Final Verdict
Qlik Sense is suitable for businesses seeking a flexible and intuitive BI tool that promotes data discovery and self-service analytics. Its associative data model makes it unique, and its intuitive user interface encourages deeper exploration of data without advanced technical knowledge.
Pros of Qlik Sense
- Innovative associative data model enables deeper insights
- Encourages self-service BI across business teams
- Strong visualization and reporting capabilities
- Scalable for large enterprises and growing businesses
- Flexible and customizable to fit diverse business needs
Cons of Qlik Sense
- May take time to learn and fully understand the associative data model
- Pricing for advanced features can be on the higher side
- Complex dashboards may overwhelm less experienced users
#4 – Looker – Data Exploration with a Modern Approach
Looker, now part of Google Cloud, provides a modern and flexible platform for data exploration and business intelligence. It is particularly focused on real-time analytics and has a unique approach to data modeling with LookML, which allows businesses to define custom metrics and data relationships. This enables Looker to cater to organizations that require in-depth, real-time reporting and data analysis capabilities, providing a powerful solution that integrates with other platforms such as Google BigQuery. With Looker, businesses can leverage customizable data models and gain actionable insights from their data, all within an integrated and scalable environment.
Review
Looker utilizes a modeling language called LookML, allowing for the creation of custom data models. Its integration with Google BigQuery and other databases facilitates real-time data analysis and reporting, enabling businesses to make data-driven decisions instantly. The platform’s cloud-native nature ensures scalability, while its customizable dashboard options provide users with the flexibility to focus on the metrics that matter most. Looker is ideal for companies looking for deep analytics and data exploration, especially those already using Google Cloud.
Features of Looker
- LookML Modeling: Define data relationships and metrics for consistent and reliable analysis.
- Real-Time Dashboards: Monitor and analyze key metrics with up-to-date data for better decision-making.
- Embedded Analytics: Seamlessly integrate analytics into other applications to extend BI capabilities across your business.
- Collaboration: Share insights and collaborate on data exploration across departments.
- Scalability: Looker is designed to scale, ensuring it can handle large data volumes for enterprise-level businesses.
Final Verdict
Looker is best suited for organizations that require real-time data analysis and have the technical resources to leverage its powerful modeling capabilities. With its seamless integration with Google Cloud and strong customization options, Looker is ideal for data-driven businesses that value deep data exploration.
Pros of Looker
- Real-time data analytics for quick decision-making
- Customizable data models for tailored insights
- Strong integration with Google Cloud services
- Scalable for enterprise needs
- Cloud-native, ensuring flexibility and accessibility
Cons of Looker
- Requires knowledge of LookML for effective customization
- Higher cost for smaller businesses or teams
- Limited functionalities in the base version
#5- Sisense – End-to-End BI Platform with Embedded Analytics
Sisense offers a comprehensive business intelligence platform designed to manage complex data and provide embedded analytics solutions. Its end-to-end approach enables businesses to process, analyze, and visualize data from multiple sources in a seamless manner. Sisense’s unique In-Chip technology accelerates data processing, allowing businesses to derive insights faster and more efficiently. Whether integrating analytics into existing applications or creating custom dashboards for specific needs, Sisense is built to handle large data volumes, providing a robust and scalable solution for businesses looking to unlock the full potential of their data.
Review
Sisense stands out with its ability to handle complex data and provide embedded analytics solutions. Its In-Chip technology accelerates data processing, allowing for faster insights. Sisense also offers robust customization and integration options, making it suitable for large enterprises and organizations with complex data environments. Whether used for advanced analytics or embedded into applications, Sisense offers a comprehensive BI solution for a wide range of business needs.
Features of Sisense
- In-Chip Technology: Enhances data processing speed and efficiency, enabling real-time insights.
- Embedded Analytics: Integrate analytics seamlessly into existing applications, providing contextual insights to end users.
- Custom Dashboards: Create interactive dashboards tailored to specific business needs.
- Data Integration: Connects to various data sources, including cloud and on-premises databases.
- Scalability: Sisense is built to handle large data volumes, making it suitable for enterprises with significant data needs.
Final Verdict
Sisense is ideal for organizations looking for a robust BI solution that offers embedded analytics and can manage complex data environments. Its performance-driven technology makes it one of the best BI platforms for organizations needing fast and accurate insights.
Pros of Sisense
- High-performance data processing capabilities
- Embedded analytics feature enhances user experience
- Customizable dashboards and reports for diverse business needs
- Scalable to accommodate large data volumes
- Strong data integration capabilities
Cons of Sisense
- Complex to set up for smaller businesses
- Higher pricing tiers for more advanced features
- Requires some technical expertise for advanced integrations
#6 – SAP BusinessObjects – Enterprise-Grade BI for Comprehensive Reporting
SAP BusinessObjects is a robust business intelligence suite designed for large enterprises seeking comprehensive reporting, analysis, and data visualization capabilities. It offers a centralized platform to transform raw data into meaningful insights, facilitating informed decision-making across organizations.
Review
SAP BusinessObjects provides a wide array of tools for ad-hoc reporting, dashboards, and data exploration. Its integration with SAP’s ecosystem ensures seamless data flow and consistency. However, users have noted challenges with its complexity and the resources required for optimal performance.
Features of SAP BusinessObjects
- Ad-Hoc Reporting: Empowers users to create custom reports without IT intervention.
- Interactive Dashboards: Visualize data through dynamic and interactive dashboards.
- Data Integration: Connects with various data sources, including SAP and non-SAP systems.
- Role-Based Access Control: Ensures data security by assigning permissions based on user roles.
- Mobile Accessibility: Access reports and dashboards on mobile devices for on-the-go insights.
Final Verdict
SAP BusinessObjects is ideal for large organizations requiring a comprehensive BI solution integrated within the SAP ecosystem. While it offers powerful features, the platform’s complexity and resource demands may pose challenges for some users.
Pros of SAP BusinessObjects
- Comprehensive reporting and analysis tools
- Seamless integration with SAP systems
- Robust data security features
- Scalable for large enterprise needs
Cons of SAP BusinessObjects
- Complex setup and maintenance
- High resource and infrastructure requirements
- Steep learning curve for new users
- Upgrading can be challenging
#7 – IBM Cognos Analytics – AI-Driven BI for Informed Decision-Making
IBM Cognos Analytics is a comprehensive BI platform that leverages artificial intelligence to enhance data discovery and reporting. It caters to organizations aiming to make data-driven decisions through intuitive analytics and visualization tools.IBM Cognos Analytics supports advanced forecasting, interactive dashboards, and automated data preparation. It integrates seamlessly with various data sources, making it a solid choice for enterprises needing scalable, AI-powered insights.
Review
Cognos Analytics offers a user-friendly interface with drag-and-drop features, facilitating report creation and data exploration. Its AI capabilities assist in uncovering hidden patterns and insights. However, some users have pointed out areas for improvement in visualization quality and performance.
Features of IBM Cognos Analytics
- AI-Powered Insights: Utilizes AI to suggest relevant data visualizations and insights.
- Self-Service Reporting: Enables users to create reports without extensive technical knowledge.
- Data Governance: Maintains data integrity and security across the organization.
- Integration Capabilities: Connects with various data sources and applications.
- Mobile Support: Access reports and dashboards on mobile devices.
Final Verdict
IBM Cognos Analytics is suitable for organizations seeking an AI-enhanced BI solution that promotes self-service reporting and data governance. While it offers robust features, enhancements in visualization and performance could further elevate the user experience.
Pros of IBM Cognos Analytics
- AI-driven data insights
- User-friendly interface
- Strong data governance features
- Flexible integration options
Cons of IBM Cognos Analytics
- Visualization tools may lack advanced features
- Performance can be slower compared to competitors
- Technical support response times could be improved
#8 – Zoho Analytics – Affordable BI for Small to Medium Businesses
Zoho Analytics is a self-service BI and data analytics platform designed for small to medium-sized businesses. It enables users to analyze data, create visualizations, and share insights without requiring extensive technical expertise.Zoho Analytics offers AI-powered assistant Zia for natural language querying and smart insights. It also supports a wide range of integrations, making it easy to pull data from business apps like CRM, finance, and marketing tools.
Review
Zoho Analytics offers an intuitive drag-and-drop interface, making it accessible for users with varying technical backgrounds. Its affordability and ease of use make it an attractive option for businesses seeking to implement BI solutions without significant investment. However, some users have noted limitations in advanced analytics capabilities.
Features of Zoho Analytics
- Drag-and-Drop Interface: Simplifies report and dashboard creation.
- Data Blending: Combine data from multiple sources for comprehensive analysis.
- AI-Powered Assistant: Zia, Zoho’s AI assistant, provides insights and answers queries.
- Scheduled Reporting: Automate report generation and distribution.
- Integration: Seamlessly connects with other Zoho apps and third-party services.
Final Verdict
Zoho Analytics is an excellent choice for small to medium-sized businesses seeking an affordable and user-friendly BI solution. While it may lack some advanced features, its ease of use and integration capabilities make it a valuable tool for data analysis.
Pros of Zoho Analytics
- Cost-effective pricing
- User-friendly interface
- AI-powered insights
- Wide range of integrations
Cons of Zoho Analytics
- Limited advanced analytics features
- Performance may lag with large data sets
#9 – Oracle Analytics Cloud – Scalable Cloud-Based BI Solution
Oracle Analytics Cloud is a comprehensive cloud-based BI platform that offers data visualization, reporting, and predictive analytics capabilities. It is designed to help organizations derive insights from their data through interactive dashboards and advanced analytics.
Review
Oracle Analytics Cloud provides a user-friendly interface and robust analytics tools, enabling users to explore data and generate insights efficiently. Its integration with Oracle’s suite of applications ensures seamless data flow. However, some users have reported occasional performance issues and a need for more diverse data connectors.
Features of Oracle Analytics Cloud
- Data Visualization: Create interactive and customizable dashboards.
- Predictive Analytics: Utilize machine learning models for forecasting.
- Self-Service Data Preparation: Clean and transform data without coding.
- Mobile Accessibility: Access analytics on mobile devices.
- Integration: Connects with various data sources and Oracle applications.
Final Verdict
Oracle Analytics Cloud is well-suited for organizations seeking a scalable and integrated cloud-based BI solution. While it offers powerful features, addressing performance issues and expanding data connectivity options could enhance its effectiveness.
Pros of Oracle Analytics Cloud
- Scalable cloud infrastructure
- Advanced analytics capabilities
- User-friendly interface
- Seamless integration with Oracle applications
Cons of Oracle Analytics Cloud
- Occasional performance lags
- Limited data connector options
- Dashboard customization could be improved
#10 – SAS Business Intelligence – Advanced Analytics for Data-Driven Decisions
SAS Business Intelligence is a suite of applications designed to facilitate data analysis, reporting, and visualization. It caters to organizations that require advanced analytics capabilities to drive informed decision-making.It is especially valued in industries like healthcare, finance, and government for its robust statistical and predictive modeling features.
Review
SAS BI offers a comprehensive set of tools for data exploration and reporting, supported by robust statistical analysis features. Its scalability and integration capabilities make it suitable for large enterprises. However, the platform’s complexity and cost may be prohibitive for smaller organizations.
Features of SAS Business Intelligence
- Advanced Analytics: Leverage statistical models for in-depth analysis.
- Interactive Dashboards: Create dynamic visualizations for data exploration.
- Data Integration: Connects with various data sources for comprehensive analysis.
- Collaboration Tools: Share insights and reports across teams.
- Mobile Support: Access analytics on mobile devices.
Final Verdict
SAS Business Intelligence is ideal for organizations requiring advanced analytics and comprehensive data integration. While it offers powerful features, its complexity and cost may limit its accessibility for smaller businesses.
Pros of SAS Business Intelligence
- Robust statistical analysis capabilities
- Scalable for large enterprises
- Comprehensive data integration
- Strong support and community resources
Cons of SAS Business Intelligence
- High cost of ownership
- Steep learning curve
- Complex setup and maintenance
- Strong embedded analytics capabilities
- Flexible data integration options
- Scalable for growing businesses
Cons of Sisense
- May require technical expertise for setup
- Premium pricing for advanced features
#11 – Domo – Cloud-Based BI for Real-Time Data Insights
Domo provides a cloud-based business intelligence platform that offers real-time data visualization and collaboration tools.It connects seamlessly with hundreds of data sources, making data integration quick and efficient. Domo also enables teams to make faster decisions with AI-powered insights and mobile accessibility.
Review
Domo’s platform is designed for quick deployment and ease of use, enabling users to create dashboards and reports without extensive technical knowledge. Its mobile-first approach ensures accessibility across devices.
Features of Domo
- Real-Time Dashboards: Monitor business metrics as they happen.
- Data Integration: Connects to a wide range of data sources and applications.
- Collaboration Tools: Share insights and collaborate within the platform.
- Mobile Access: Fully functional mobile apps for on-the-go analytics.
- App Development: Build custom apps to meet specific business needs.
Final Verdict
Domo is suitable for organizations seeking a user-friendly, cloud-based BI solution that facilitates real-time data analysis and collaboration.Its scalability makes it ideal for both growing startups and large enterprises handling massive data volumes. With AI-driven dashboards and strong mobile support, Domo empowers on-the-go decision-making and agile business strategies.
Pros of Domo
- Quick and easy deployment
- Real-time data visualization
- Strong collaboration features
- Mobile-friendly interface
Cons of Domo
- Higher cost for premium features
- Limited customization options compared to competitors
#12 – MicroStrategy – High-Performance BI with Enterprise-Grade Scalability
MicroStrategy is a powerful enterprise business intelligence platform known for its high scalability, in-memory analytics, and real-time dashboards. It is tailored for businesses that require rapid data access, robust governance, and advanced analytics capabilities.
Review
MicroStrategy stands out with its speed, powerful mobile capabilities, and strong data governance features. Its centralized metadata and semantic layer provide a consistent user experience across teams. However, the platform can be expensive and requires a technical team for full implementation.
Features of MicroStrategy
- HyperIntelligence: Provides contextual insights directly in business applications.
- Mobile BI: Offers rich analytics experiences on iOS and Android.
- In-Memory Analytics: Delivers fast performance on large datasets.
- Governed Data Discovery: Ensures security and control across the organization.
- Scalable Architecture: Supports thousands of users without performance dips.
Final Verdict
MicroStrategy is a top-tier BI platform for large organizations that value speed, security, and scalability. Though it requires significant investment, it delivers high returns through enterprise-ready tools and advanced analytics.
Pros of MicroStrategy
- Exceptional scalability and performance
- Strong data governance and security
- Innovative HyperIntelligence feature
- Powerful mobile support
Cons of MicroStrategy
- Steep licensing and maintenance costs
- Complex deployment and learning curve
- Requires skilled IT resources (techradar.com)
#13 – Yellowfin BI – Integrated BI with Strong Collaboration Tools
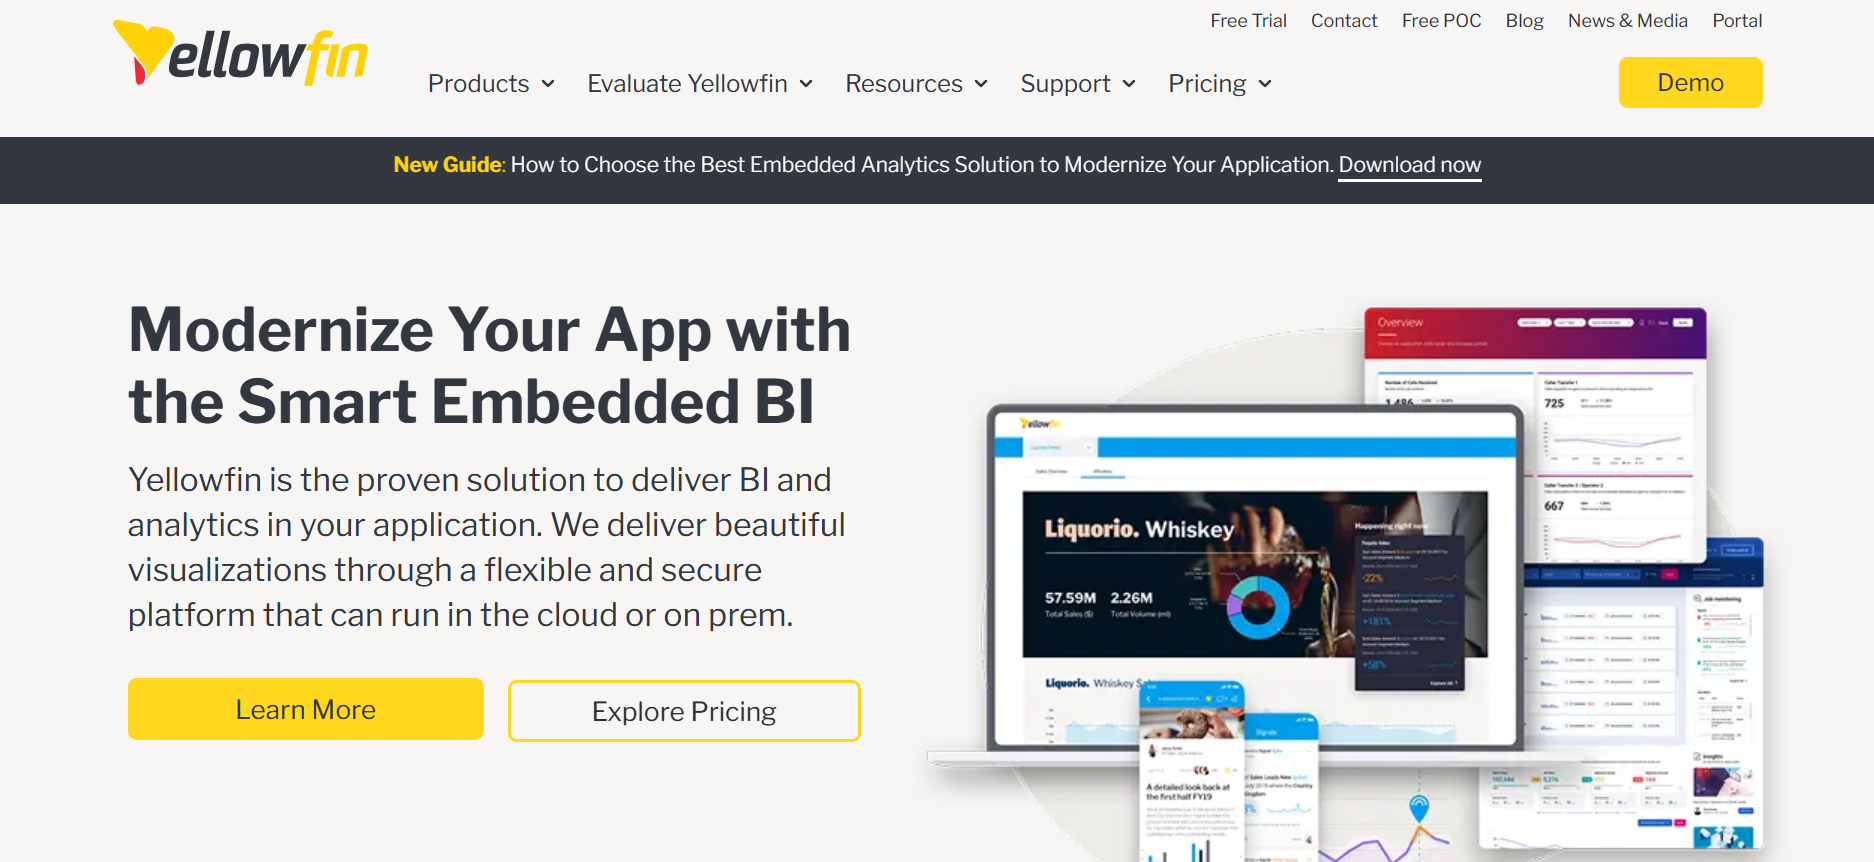
Yellowfin BI is a modern BI platform that blends traditional reporting with cutting-edge analytics and collaborative capabilities. It is known for its data storytelling and intuitive dashboards that make analytics accessible to all users.It also supports augmented analytics, allowing users to automatically discover insights and trends without deep technical knowledge.
Review
Yellowfin offers a unique blend of data discovery, storytelling, and collaboration. Users can comment on and share insights directly within the platform, encouraging team-based decision-making. Some users, however, report occasional lags in performance with large datasets.
Features of Yellowfin BI
- Data Storytelling: Transform analytics into interactive narratives.
- Collaborative BI: Share and annotate reports in real-time.
- Automated Signals: Automatically detect and notify changes in data.
- Smart Dashboards: Customizable and responsive dashboards.
- Integrated ETL: Connect, prepare, and visualize data from multiple sources.
Final Verdict
Yellowfin BI is perfect for teams looking to combine traditional analytics with collaborative storytelling. While it’s not as robust for deep data science, it’s ideal for quick, visual insights and cross-team collaboration.
Pros of Yellowfin BI
- Exceptional data storytelling
- Strong collaboration tools
- Easy to use and deploy
- Real-time automated insights
Cons of Yellowfin BI
- Performance issues with large datasets
- Limited advanced analytics for data scientists
- Not as customizable as some competitors
#14 – TIBCO Spotfire – Smart Analytics with Predictive Power
TIBCO Spotfire is a powerful business intelligence and data visualization platform that emphasizes predictive analytics, real-time insights, and AI-driven data exploration. It’s widely used in industries such as energy, healthcare, and manufacturing for advanced data discovery.
Review
Spotfire offers a visually rich interface and supports a wide range of data sources. Its predictive analytics capabilities, powered by TIBCO Data Science, are a standout feature. However, users may find the learning curve steep, especially for advanced functionality.
Features of TIBCO Spotfire
- AI-Powered Data Discovery: Automatically identifies patterns, trends, and anomalies.
- Predictive Analytics: Includes R and Python integration for advanced statistical modeling.
- Real-Time Analytics: Analyze streaming data as it’s generated.
- Custom Dashboards: Create highly interactive and tailored visualizations.
- GeoAnalytics: Visualize geographic data with built-in mapping tools.
Final Verdict
TIBCO Spotfire is a strong choice for organizations needing real-time analytics and predictive capabilities. Its advanced features make it a favorite for data scientists, though it may be overkill for users needing only basic BI tools.
Pros of TIBCO Spotfire
- Robust predictive analytics
- Real-time data processing
- Flexible dashboard customization
- Strong support for scripting (R, Python)
Cons of TIBCO Spotfire
- Steep learning curve for new users
- Higher cost for enterprise-level features
- Less intuitive interface compared to competitors
#15 – ThoughtSpot – Search-Driven Analytics for Instant Insights
ThoughtSpot is a modern BI tool that provides search-based and AI-driven analytics designed for non-technical users. It allows users to ask questions in natural language and receive instant, visual responses.
Review
ThoughtSpot excels in its user-friendly, Google-like interface that supports natural language querying. Its AI engine, SpotIQ, delivers automated insights, making it especially valuable for business teams without technical backgrounds. However, advanced customization options are somewhat limited.
Features of ThoughtSpot
- Search-Based Analytics: Ask questions using simple, conversational language.
- SpotIQ AI Engine: Automatically surfaces key trends and outliers.
- Cloud-Native Architecture: Fast and scalable performance in the cloud.
- Self-Service BI: Empowers users to explore data independently.
- Embedded Analytics: Integrate dashboards and search within other apps.
Final Verdict
ThoughtSpot is ideal for organizations prioritizing self-service analytics and simplicity. It democratizes data access, though it may not suit companies with highly complex reporting or modeling needs.
Pros of ThoughtSpot
- Highly intuitive search-based interface
- Quick deployment and easy to use
- AI-generated automated insights
- No coding required for queries
Cons of ThoughtSpot
- Limited advanced customization options
- Less suitable for deep technical analytics
- Cost may be high for smaller teams
Frequently Asked Questions (FAQs)
What is the best business intelligence software in the USA?
The top BI software options in the USA include:
- SAP BusinessObjects (best for large enterprises),
- IBM Cognos Analytics (best for scalability and advanced analytics),
- Zoho Analytics (best for small to medium-sized businesses).
Other great tools are Oracle Analytics Cloud, SAS Business Intelligence, MicroStrategy, and TIBCO Spotfire. These options cater to various business needs, from analytics to real-time data processing.
What is the best business intelligence software for small businesses?
For small businesses, great options include:
- Zoho Analytics (affordable and user-friendly),
- Yellowfin BI (simple setup and quick insights),
- MicroStrategy (scalable and customizable).
These platforms provide powerful features without overwhelming small teams with complexity.
What is the best business intelligence software for large enterprises?
For large enterprises, the top BI tools include:
- SAP BusinessObjects (enterprise-grade analytics and data integration),
- IBM Cognos Analytics (robust reporting and dashboard capabilities),
- Oracle Analytics Cloud (extensive cloud features and big data integration).
These platforms support high-level data processing and advanced analytics, ideal for large teams with complex needs.
How do I choose the best business intelligence software?
Start by evaluating your company’s size, data needs, and budget. Look for features like advanced analytics, real-time data processing, ease of use, and integration capabilities. Many tools offer free trials or demos, allowing you to test functionality and user experience before committing to a solution.
What are the benefits of using business intelligence software?
Business intelligence software provides valuable insights by analyzing large datasets. It improves decision-making by presenting data through interactive dashboards, reporting tools, and predictive analytics. BI tools help businesses identify trends, optimize operations, and make data-driven decisions for better strategic planning.
What factors determine the best business intelligence software?
Key factors include:
- Ease of use
- Integration with existing systems
- Advanced analytics and reporting capabilities
- Scalability and customization
- Cloud or on-premises solutions
The best BI software will align with your organization’s specific needs, ensuring smooth data processing and insightful analysis.