
The best business intelligence (BI) software platforms in 2027 are Microsoft Power BI, Tableau, and Looker for enterprise-grade reporting, interactive data visualization, and governed metric modeling. For specialized needs, organizations turn to platforms like Qlik Sense for associative data discovery, ThoughtSpot for natural language search analytics, Domo for rapid cloud data integration, and Metabase for lightweight, open-source querying.
Modern business intelligence software serves as the vital link between massive, raw data stores and day-to-day strategic decisions. Rather than forcing teams to manually stitch together disconnected spreadsheets or wait on congested IT queues, modern BI platforms centralize data ingestion, automate reporting workflows, and deliver interactive, self-service dashboards. With native AI and machine learning now handling anomaly detection, automated insight generation, and natural language queries, organizations can uncover hidden operational trends in minutes.
Selecting the right BI tool requires aligning your data architecture with your team’s technical maturity. Organizations must weigh deep ecosystem integrations (such as Microsoft 365, Google Cloud, or AWS) against factors like semantic data governance, deployment agility, and mobile accessibility. Evaluating per-seat versus consumption-based pricing models also ensures your analytics capabilities scale cost-effectively without creating license-driven data bottlenecks.
What are Best Business Intelligence Software in 2027?
Our top choices are:
- Microsoft Power BI — Best for Microsoft 365 Integration & Scalable Self-Service BI
- Tableau — Best for Advanced Data Visualization & Visual Storytelling
- Looker — Best for Centralized Semantic Modeling & Google Cloud Governance
- Qlik Sense — Best for Associative Data Exploration & Complex Multi-Source Discovery
- ThoughtSpot — Best for Natural Language Search & AI-Driven Analytics
- Domo — Best for Rapid Multi-Source Cloud Integration & Real-Time Dashboards
- Sisense — Best for Developer-Centric Embedded Analytics & Complex Data Models
- Zoho Analytics — Best Low-Cost BI Solution for Growing Small-to-Midsize Businesses
- Metabase — Best Open-Source & Developer-Friendly Lightweight BI Tool
- Sigma Computing — Best Cloud Analytics Platform with Familiar Spreadsheet Workflows
- IBM Cognos Analytics — Best for Enterprise-Grade Governance & AI Data Preparation
- SAP BusinessObjects — Best for Large Multinational Organizations with Legacy SAP ERP Stacks
- TIBCO Spotfire — Best for Advanced Statistical Analysis & Streaming Data Science
- Yellowfin BI — Best for Automated Business Monitoring & Collaborative Storytelling
- Amazon QuickSight — Best Serverless Cloud BI Engine for AWS Ecosystem Workflows
What is Business Intelligence (BI) Software?
Business Intelligence (BI) software comprises dedicated applications designed to extract, clean, analyze, and visualize structured and semi-structured data across an enterprise. These platforms translate raw transactional data from relational databases, cloud data warehouses, and SaaS APIs into accessible dashboards, scheduled operational reports, and interactive charts.
Unlike basic spreadsheets that require manual data entry and static formulas, modern BI tools maintain live, automated pipelines to underlying databases. This architecture provides business stakeholders with a real-time, unified single source of truth for tracking organizational performance, revenue metrics, customer behavior, and operational efficiency.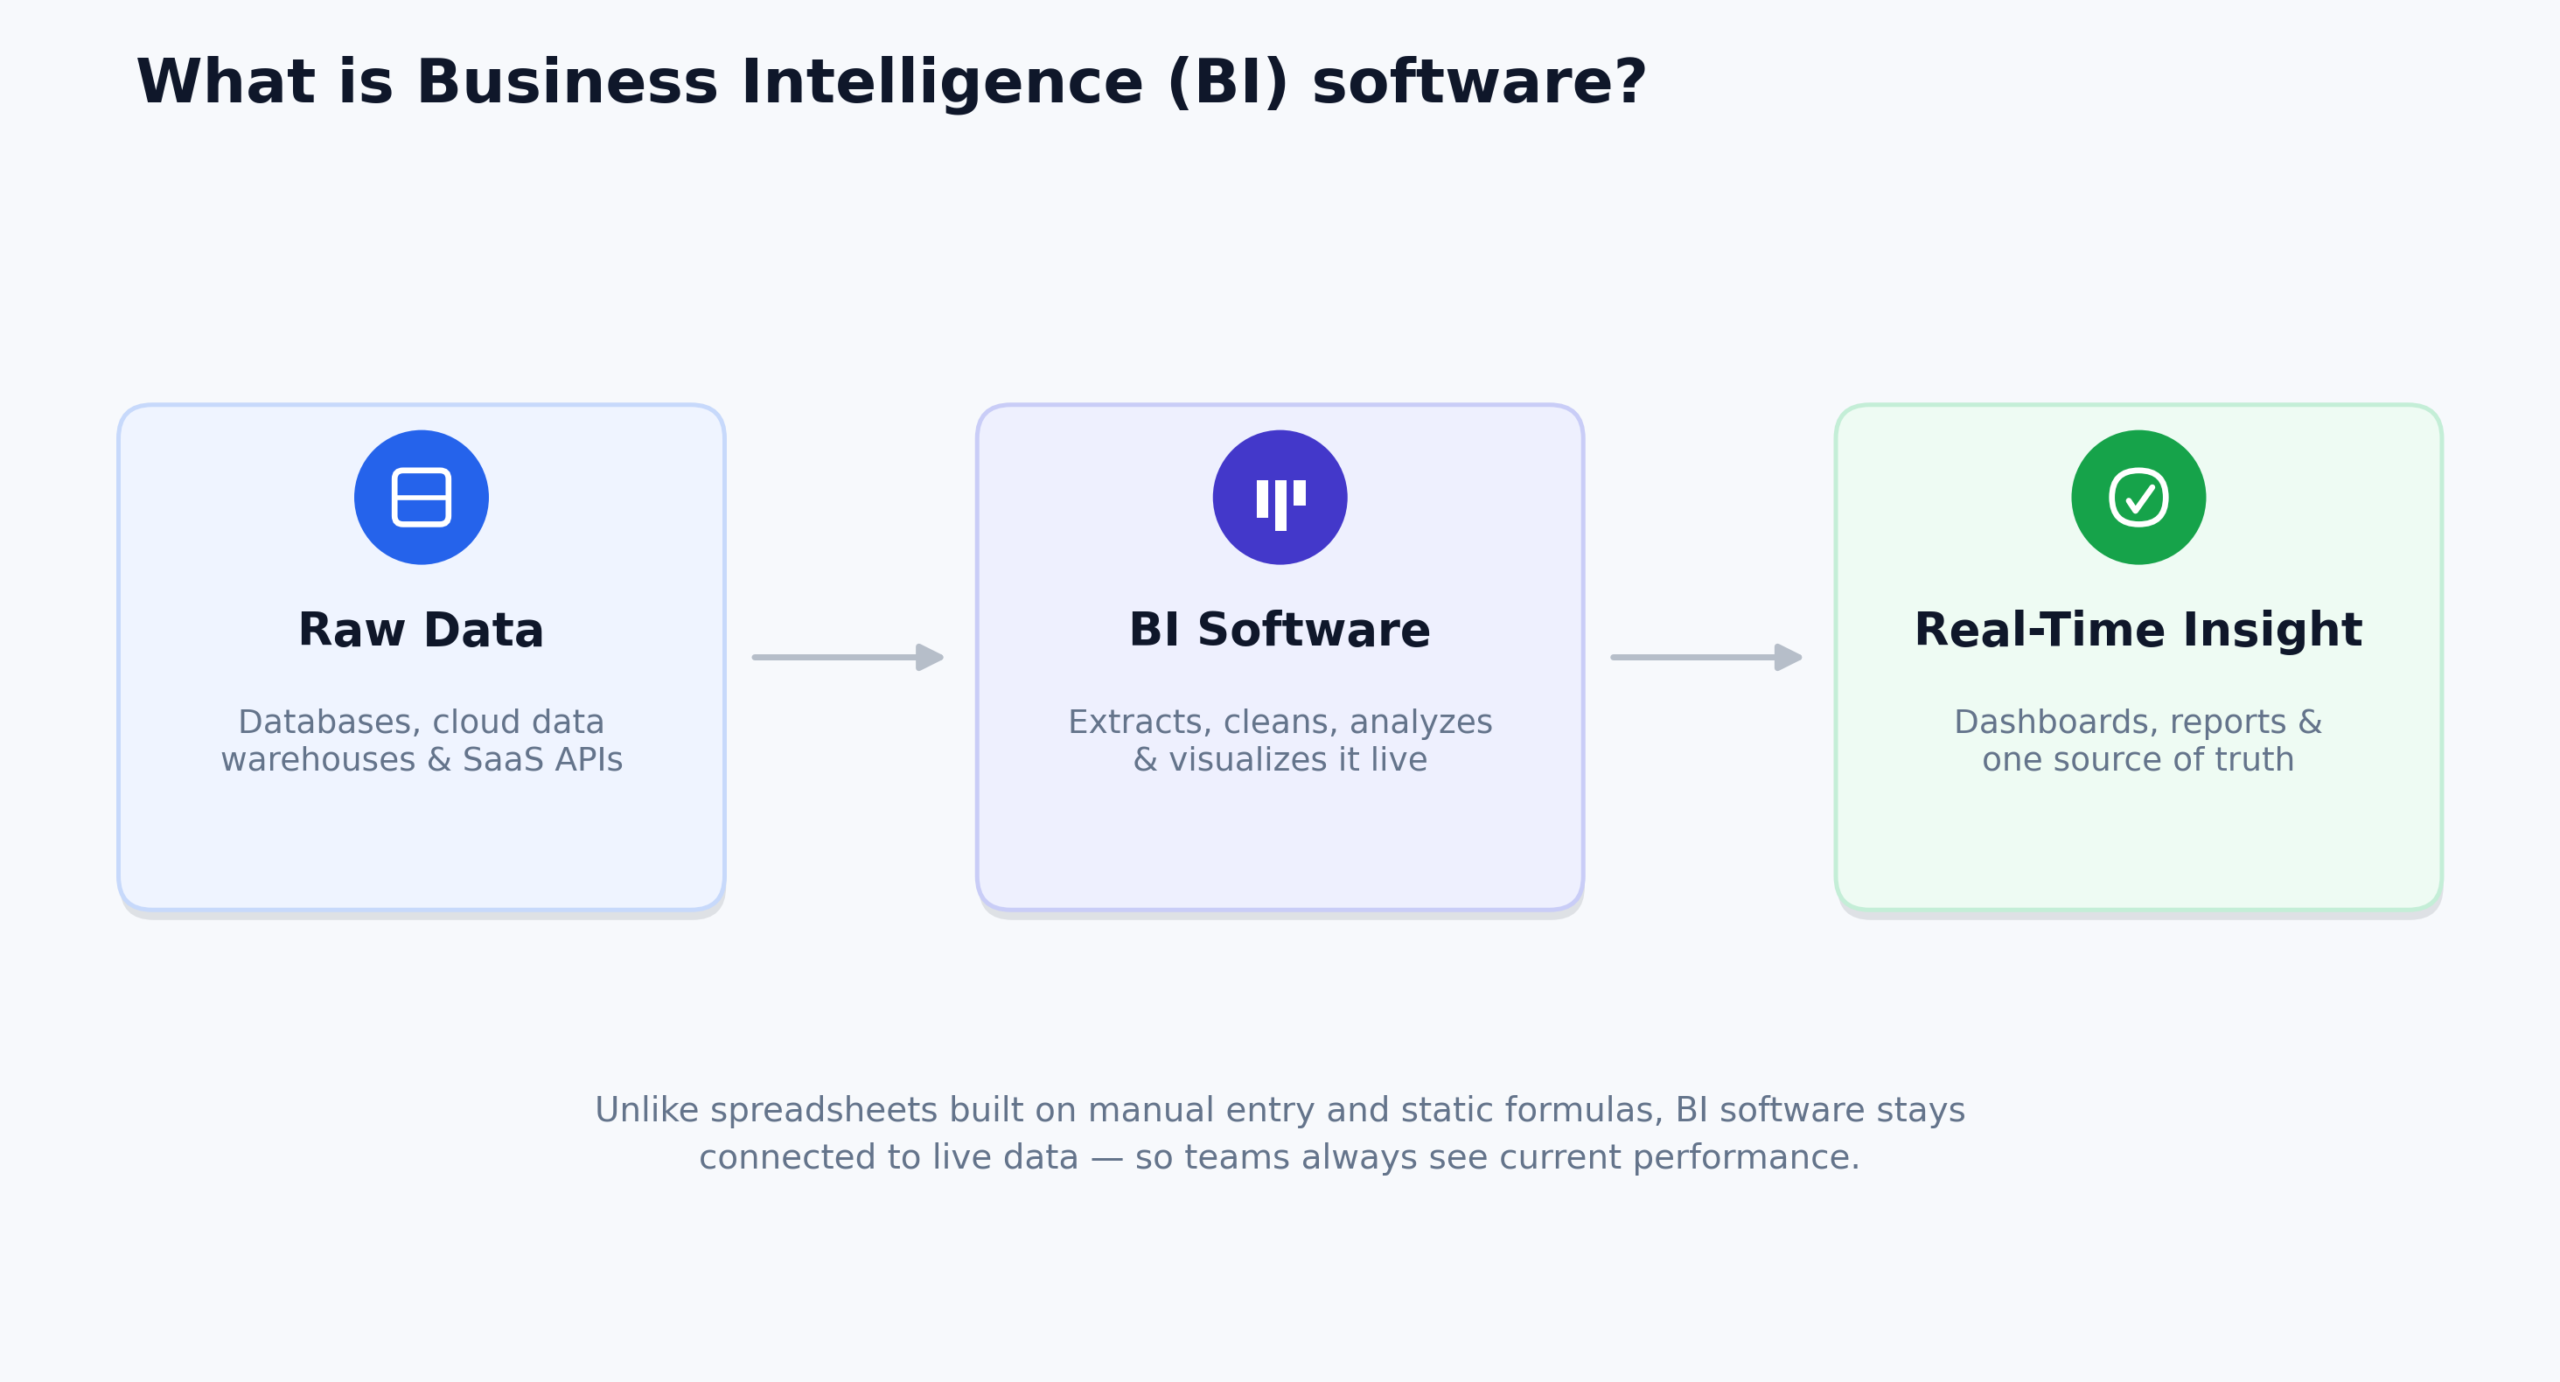
How to Choose the Right BI Software in 2027
When evaluating prospective business intelligence vendors, focus on these essential criteria:
- Data Stack Compatibility: Verify native, high-performance connectors for your core data warehouses and lakes (such as Snowflake, BigQuery, Databricks, Amazon Redshift, or PostgreSQL).
- Semantic Layer vs. Visual Freedom: Decide whether your organization requires centralized metric definitions enforced by data engineers (like LookML) or flexible visual exploration for business users.
- Embedded AI & Search Maturity: Test how naturally the platform handles plain-English search queries, automated data preparation, and automated insight summaries.
- Security & Governance Standards: Ensure the platform provides granular row- and column-level security, role-based permissions, data lineage tracking, and compliance certifications (SOC 2, ISO 27001, GDPR).
- Total Cost of Ownership (TCO): Carefully assess per-user named licensing versus capacity/credit-based models, factoring in ongoing implementation, compute query consumption, and training expenses.
Key Benefits of Implementing Modern BI Software
Deploying a dedicated business intelligence solution helps modern organizations replace instinct-driven assumptions with verified data insights:
- Democratized Self-Service Analytics: Empowers non-technical department managers to build custom reports, run ad-hoc queries, and filter data independently without submitting IT tickets.
- Centralized Metric Governance: Semantic layers and data dictionaries guarantee that metrics like gross margin, churn, and annual recurring revenue (ARR) are calculated uniformly across every department.
- AI-Augmented Anomaly Detection: Machine learning algorithms continuously monitor data streams to flag unexpected performance drops, inventory shortfalls, or revenue spikes proactively.
- Accelerated Decision Cycles: Live dashboard refreshes and automated alert notifications enable executives and operators to respond to market trends in real time.
- Consolidated Data Architecture: Bridges data silos across disconnected platforms (such as CRMs, ERPs, advertising tools, and support desks) into a single operational interface.
Top 15 Best Business Intelligence Software in 2027
Below is our in-depth evaluation of the top 15 business intelligence platforms in 2027, analyzed across data modeling depth, visualization flexibility, AI integration, and total cost of ownership:
1. Microsoft Power BI — Best for Microsoft 365 Integration & Scalable Self-Service BI
Company Overview
| Detail | Information |
| Founded | 2011 |
| Headquarter | United States (Redmond, Washington) |
| Service Type | Enterprise Business Intelligence & Self-Service Analytics |
| Target Market | Small businesses to Fortune 500 enterprises using the Microsoft ecosystem |
| Core Capabilities | Power Query ETL, DAX Modeling, Copilot AI Integration, Interactive Dashboards, Microsoft Fabric Integration |
| Deployment | Cloud SaaS (Azure), Power BI Report Server (On-Premise) |
| Starting Price | Free desktop authoring; Pro from $14 / user/month; Premium Per User from $24 / user/month |
| Payment Frequency | Monthly or Annual billing |
Microsoft Power BI is widely recognized as one of the best business intelligence software in 2027 for organizations seeking an accessible, highly scalable analytics platform. By embedding natively into Microsoft 365, Azure, and Teams, Power BI allows companies to deploy self-service reporting without introducing unfamiliar third-party interfaces. Users can ingest data from over 150 sources, shape tables using Power Query, and build interactive visuals with drag-and-drop ease.
The platform provides a smooth bridge between non-technical business users and seasoned data engineers through its dual support for visual builders and advanced DAX formulas. Under Microsoft Fabric, Power BI delivers unified governance, automated anomaly detection, and natural language query generation via Copilot. Backed by enterprise-grade row-level security and flexible per-user or capacity licensing, Power BI offers exceptional value for data-driven operations.
Key Features
- Native Microsoft Integration: Frictionless data sharing across Excel, Teams, SharePoint, and Azure environments.
- Copilot AI Assistant: Generates automated narrative summaries, DAX calculations, and report pages using natural language.
- Power Query & DAX: Robust data transformation pipelines and flexible modeling language for complex business metrics.
- Granular Governance: Enterprise-grade row-level security, data lineage tracking, and automated sensitivity labels.
- Extensive Connector Library: Direct, high-speed connections to over 150 cloud, on-premises, and data warehouse sources.
Pricing
- Power BI Desktop: Free ($0 standalone authoring tool for individual data modeling and report design).
- Power BI Pro: $14 / user/month (sharing, publishing, and scheduled refreshes; included with Microsoft 365 E5).
- Power BI Premium Per User: $24 / user/month (advanced AI modeling, larger model sizes, and paginated reporting).
- Fabric Capacity: Pay-as-you-go capacity tiers starting from dynamic hourly or annual consumption commitments.
2. Tableau — Best for Advanced Data Visualization & Visual Storytelling
Company Overview
| Detail | Information |
| Founded | 2003 (Acquired by Salesforce in 2019) |
| Headquarter | United States (Seattle, Washington) |
| Service Type | Advanced Visual Analytics & Enterprise Data Storytelling |
| Target Market | Mid-market to large global enterprises, dedicated data analysts, and BI teams |
| Core Capabilities | VizQL Engine, Salesforce Einstein AI, Prep Builder, Geospatial Mapping, Collaborative Storytelling |
| Deployment | Tableau Cloud (SaaS), Tableau Server (On-Premise / Private Cloud) |
| Starting Price | Viewer from $15 / user/month; Explorer from $42 / user/month; Creator from $75 / user/month |
| Payment Frequency | Annual billing |
Tableau is widely recognized as one of the best business intelligence software in 2027 for organizations that prioritize deep visual analytics, geospatial exploration, and presentation-ready data storytelling. Powered by its patented VizQL engine, Tableau converts drag-and-drop canvas actions directly into optimized database queries. This enables data analysts to explore multi-layered datasets and construct complex custom visualizations without writing raw SQL.
As a core part of the Salesforce analytics suite, Tableau incorporates Salesforce Einstein to deliver automated trend discovery, natural language search, and predictive guidance. The platform easily handles massive enterprise data warehouses like Snowflake, BigQuery, and Databricks. While it requires a steeper learning curve than basic dashboard builders, Tableau remains the undisputed benchmark for high-fidelity visual analysis.
Key Features
- VizQL Query Engine: Translates visual drag-and-drop interactions into real-time database queries instantly.
- Einstein Discovery: Embedded predictive modeling and automated statistical summaries driven by machine learning.
- Tableau Prep Builder: Visual data preparation workspace for combining, cleaning, and reshaping unstructured inputs.
- Flexible Visual Canvas: Unlimited visual freedom supporting heatmaps, geospatial layers, and multi-axis charts.
- Global User Community: Extensive public repository of templates, forums, and custom visualizations via Tableau Public.
Pricing
- Tableau Viewer: $15 / user/month billed annually (interact with and view published dashboards and reports).
- Tableau Explorer: $42 / user/month billed annually (self-service data exploration from curated data sources).
- Tableau Creator: $75 / user/month billed annually (full authoring suite, Tableau Desktop, and Tableau Prep Builder).
- Enterprise Bundles: Custom quote (includes enterprise admin governance, Einstein AI, and dedicated support).
3. Looker — Best for Centralized Semantic Modeling & Google Cloud Governance
Company Overview
| Detail | Information |
| Founded | 2012 (Acquired by Google Cloud in 2019) |
| Headquarter | United States (Santa Cruz, California) |
| Service Type | Enterprise Data Platform, Governed Semantic Modeling & Embedded BI |
| Target Market | Data engineering teams, tech scale-ups, and modern data stack enterprises |
| Core Capabilities | LookML Semantic Modeling, BigQuery Native Optimization, Git Version Control, Embedded Analytics APIs |
| Deployment | Google Cloud SaaS, Multi-Cloud, Hybrid |
| Starting Price | Custom enterprise pricing via Google Cloud sales |
| Payment Frequency | Annual enterprise contracts |
Looker is widely recognized as one of the best business intelligence software in 2027 for companies operating modern data stacks that require absolute consistency across their reporting metrics. What sets Looker apart is LookML, a centralized semantic modeling language that defines business metrics—such as customer lifetime value or net retention—in a single, Git-versioned repository. This ensures all downstream departments execute queries against unified, verified business definitions.
Operating entirely in-database without proprietary data stores, Looker pushes SQL queries directly to live cloud data warehouses like Google BigQuery, Snowflake, and Amazon Redshift. It integrates Google Cloud’s Gemini AI to support natural language metrics querying and automated report building. For data teams committed to single-source-of-truth reliability and developer-grade version control, Looker is an industry-leading standard.
Key Features
- LookML Semantic Layer: Centralized, reusable data modeling framework preventing conflicting metric calculations.
- In-Database Execution: Runs live queries directly against connected data warehouses without data extraction delays.
- Git Version Control: Manages data models using pull requests, branching, and automated code review workflows.
- Gemini AI Integration: Natural language query parsing, automated data explanations, and automated insight cards.
- Headless & Embedded BI: Powerful REST APIs and SDKs to embed interactive dashboards into internal or customer SaaS apps.
Pricing
- Looker Enterprise: Custom quote based on platform instances, user types (Standard, Developer, Viewer), and query consumption.
4. Qlik Sense — Best for Associative Data Exploration & Complex Multi-Source Discovery
Company Overview
| Detail | Information |
| Founded | 1993 |
| Headquarter | Santa Cruz, California |
| Service Type | Augmented Analytics, Data Integration & Associative Exploration |
| Target Market | Mid-market to global enterprises managing interconnected, heterogeneous data sets |
| Core Capabilities | Qlik Associative Engine, Insight Advisor AI, Hybrid Cloud Deployment, Real-Time Data Pipelines |
| Deployment | Qlik Cloud SaaS, Private Cloud, On-Premise |
| Starting Price | Standard from $825 / month (includes 25 GB data capacity and multi-user access); Enterprise custom quote |
| Payment Frequency | Monthly or Annual billing |
Qlik Sense is widely recognized as one of the best business intelligence software in 2027 for organizations that need to uncover non-obvious relationships across complex, multi-source data architectures. Unlike standard SQL-based reporting tools that force users down predetermined drill-down paths, Qlik’s proprietary Associative Engine keeps all data points indexed in memory, visually highlighting both associated values and unassociated outliers whenever a filter is selected.
This unique architecture enables exploratory analysis, helping decision-makers spot overlooked operational risks, sales gaps, and supply chain bottlenecks. The platform features the Qlik Insight Advisor, an AI engine that suggests automated charts, interprets conversational questions, and proactively alerts teams to statistical anomalies. With hybrid-cloud deployment models, Qlik provides dependable enterprise-grade speed and flexibility.
Key Features
- Associative Engine: Retains all data relationships in memory, dynamically revealing unassociated data points.
- Insight Advisor: Automated AI assistant for natural language interaction, chart creation, and anomaly alerts.
- Data Integration Fabric: Real-time data pipeline capabilities including change data capture (CDC) and automated ETL.
- Self-Service Creation: Drag-and-drop dashboard design with interactive filtering across any visual dimension.
- Hybrid Deployment: Seamlessly deploy across on-premise servers, private cloud instances, or managed Qlik Cloud.
Pricing
- Qlik Cloud Standard: From $825 / month (up to 25 GB analyzed data volume, foundational AI insights).
- Qlik Cloud Premium: From $2,750 / month (up to 50 GB data capacity, advanced automation, predictive analytics).
- Enterprise: Custom quote (unlimited scale, advanced governance, dedicated infrastructure, and high data capacity).
5. ThoughtSpot — Best for Natural Language Search & AI-Driven Analytics
Company Overview
| Detail | Information |
| Founded | 2012 |
| Headquarter | United States (Mountain View, California) |
| Service Type | Search-Driven Analytics & Augmented Business Intelligence |
| Target Market | Fast-moving mid-market and enterprise organizations looking to empower non-technical users |
| Core Capabilities | Relational Search Engine, ThoughtSpot Sage (GenAI), SpotIQ Automated Anomaly Detection, Liveboards |
| Deployment | Cloud-based SaaS, Embedded (ThoughtSpot Everywhere) |
| Starting Price | Team edition from $95 / user/month; Enterprise custom pricing |
| Payment Frequency | Monthly or Annual billing |
ThoughtSpot is widely recognized as one of the best business intelligence software in 2027 for companies looking to eliminate static dashboards and give every business user conversational data access. The platform replaces traditional menu-driven BI with a familiar Google-like search bar. Users simply type plain-English questions, and ThoughtSpot’s relational search engine queries the underlying cloud data warehouse in real time to generate interactive charts.
Through ThoughtSpot Sage, the platform leverages advanced large language models (LLMs) to interpret conversational nuances, suggest relevant business questions, and auto-generate narrative summaries. Its SpotIQ engine works in the background, executing machine learning models to detect subtle trends and anomalies without manual query setup. For modern organizations wanting true self-service analytics without training business users on SQL, ThoughtSpot is an outstanding choice.
Key Features
- Conversational Search Analytics: Type questions in plain English to generate accurate, interactive visual answers on the fly.
- ThoughtSpot Sage: LLM-powered analytics interface offering conversational filtering, synonyms, and automated insights.
- SpotIQ AI Engine: Automated root-cause analysis and proactive anomaly detection running across live data streams.
- Interactive Liveboards: Dynamic visual boards that allow instant drilling, filtering, and cross-metric exploration.
- Live Querying: Executes queries directly in Snowflake, Databricks, BigQuery, and Redshift without data duplication.
Pricing
- Team Edition: From $95 / user/month (for smaller groups connecting to cloud data warehouses).
- Pro & Enterprise: Custom quote based on user counts, compute usage, and advanced governance features.
- ThoughtSpot Everywhere: Custom quote for OEM embedded analytics inside customer-facing web applications.
6. Domo — Best for Rapid Multi-Source Cloud Integration & Real-Time Dashboards
Company Overview
| Detail | Information |
| Founded | 2010 |
| Headquarter | United States (American Fork, Utah) |
| Service Type | Cloud-Native BI, Data Integration & Low-Code App Platform |
| Target Market | Mid-market businesses and fast-growing enterprises needing rapid data unification |
| Core Capabilities | 1,000+ Native Connectors, Magic ETL, Mobile-First Visual Dashboards, Domo.AI, Custom Business Apps |
| Deployment | Cloud-based SaaS, Hybrid Multi-Cloud |
| Starting Price | Consumption-based credit pricing; Free trial available |
| Payment Frequency | Monthly or Annual billing |
Domo is widely recognized as one of the best business intelligence software in 2027 for organizations needing to unify hundreds of disconnected data sources and launch executive-ready dashboards in days rather than months. Featuring a library of more than 1,000 native connectors, Domo pulls data from spreadsheets, social channels, legacy databases, and enterprise cloud applications without requiring custom integration scripts.
The platform provides an end-to-end data stack in a single tool, combining visual data preparation (Magic ETL), real-time alerts, and interactive reporting. Domo was built from the ground up for mobile devices, giving executives and field teams access to live operational metrics and collaboration tools on the go. Its credit-based pricing model lets organizations provide access to large teams without being restricted by rigid per-seat licensing.
Key Features
- 1,000+ Pre-Built Connectors: Rapid integration with virtually every major cloud application, database, and marketing API.
- Magic ETL: Intuitive drag-and-drop data preparation pipeline requiring zero SQL knowledge to clean and merge tables.
- Mobile-First Experience: Full-featured iOS and Android apps for viewing real-time reports and executing operational alerts.
- Domo.AI Framework: Automated predictive insights, text generation, and conversational querying for business users.
- Low-Code App Creation: Custom dashboard apps that let team members trigger downstream workflows directly from data cards.
Pricing
- Credit-Based Consumption: Flexible pricing based on compute and storage credits consumed rather than strict seat tiers.
- Enterprise Packages: Custom quotes with volume discounts, dedicated governance features, and enterprise-grade SLA tiers.
7. Sisense — Best for Developer-Centric Embedded Analytics & Complex Data Models
Company Overview
| Detail | Information |
| Founded | 2004 |
| Headquarter | United States (New York) |
| Service Type | Embedded Analytics, API-First BI & Mashup Data Modeling |
| Target Market | B2B SaaS product companies, software developers, and enterprise analytics engineers |
| Core Capabilities | Sisense Fusion, In-Chip Data Engine, Embedded SDKs, White-Label Analytics, Generative AI Copilot |
| Deployment | Cloud SaaS, Self-Hosted (Linux/Kubernetes), Hybrid |
| Starting Price | Custom enterprise pricing tailored to deployment scale and OEM requirements |
| Payment Frequency | Annual enterprise contracts |
Sisense is widely recognized as one of the best business intelligence software in 2027 for software product teams and engineering leaders looking to embed interactive dashboards directly into commercial applications. Built with an API-first architecture, Sisense provides flexible SDKs, white-label UI components, and REST interfaces that let developers integrate analytics into their own customer-facing software without building reporting tools from scratch.
Under the hood, Sisense Fusion enables analytics teams to join complex, multi-source data models without forcing expensive preprocessing in a central warehouse. Its proprietary In-Chip engine processes queries across millions of records quickly, while embedded generative AI tools give end-users conversational analytics inside your application. For tech companies monetizing data through customer portals, Sisense is an industry leader.
Key Features
- Developer-Grade SDKs: Comprehensive JavaScript libraries and APIs to embed custom-branded analytics into web products.
- In-Chip & Live Execution: Hybrid data engine allowing in-memory acceleration or live queries against cloud data warehouses.
- White-Label Customization: Complete control over CSS styling, fonts, and interaction patterns to match your corporate brand.
- Multi-Source Data Mashups: Combines data across diverse operational databases, NoSQL repositories, and SaaS platforms.
- Generative AI Assistant: Context-aware conversational querying and automated chart suggestions for end-users.
Pricing
- OEM & Embedded Licensing: Custom quote tailored to product scale, customer access volume, and architectural requirements.
- Enterprise Analytics: Custom quote based on active developer seats, viewer consumption, and infrastructure hosting.
8. Zoho Analytics — Best Low-Cost BI Solution for Growing Small-to-Midsize Businesses
Company Overview
| Detail | Information |
| Founded | 2009 |
| Headquarter | India (Chennai) |
| Service Type | Self-Service BI, Data Visualization & Collaborative Analytics |
| Target Market | Small-to-midsize businesses, marketing agencies, and Zoho ecosystem users |
| Core Capabilities | Zia AI Conversational Assistant, 500+ App Connectors, White-Label Portals, Auto-Blended Dashboards |
| Deployment | Cloud-based SaaS, On-Premise (Windows/Linux) |
| Starting Price | Basic plan from $24 / month (billed annually, includes 2 users) |
| Payment Frequency | Monthly or Annual billing |
Zoho Analytics is widely recognized as one of the best business intelligence software in 2027 for budget-conscious companies and small-to-midsize enterprises seeking robust reporting without enterprise price tags. Designed for rapid adoption, the platform connects with over 500 business applications, spreadsheets, and databases, automatically generating pre-configured dashboards for popular tools like Google Ads, QuickBooks, and Shopify.
For teams already using Zoho CRM, Zoho Desk, or Zoho Books, the platform provides seamless cross-functional reporting across sales, support, and finance. It features Zia, an AI-powered conversational assistant that translates plain-English questions into interactive charts and forecasts trends. With simple per-tier pricing, white-label options for digital agencies, and accessible setup, Zoho Analytics delivers high ROI for growing companies.
Key Features
- Zia AI Assistant: Plain-language conversational querying, automatic chart generation, and smart trend forecasting.
- Pre-Built Business Dashboards: Ready-to-use reporting templates for CRM, accounting, help desk, and marketing tools.
- Automated Data Blending: Merges data across disparate business systems to highlight cross-departmental KPIs automatically.
- White-Label Client Portals: Rebrand reporting dashboards with custom domains and logos for external client presentation.
- Collaborative Fine-Grained Sharing: Share specific reports, tabs, or views with granular read, write, and export controls.
Pricing
- Basic: $24 / month billed annually ($30 billed monthly; 2 users, 500,000 rows of data).
- Standard: $48 / month billed annually ($60 billed monthly; 5 users, 1 million rows of data).
- Premium: $115 / month billed annually ($145 billed monthly; 15 users, 5 million rows of data, Zia AI assistant).
- Enterprise: $455 / month billed annually ($575 billed monthly; 50 users, 50 million rows of data, advanced security).
9. Metabase — Best Open-Source & Developer-Friendly Lightweight BI Tool
Company Overview
| Detail | Information |
| Founded | 2014 |
| Headquarter | United States (San Francisco, California) |
| Service Type | Open-Source Business Intelligence & Lightweight Team Analytics |
| Target Market | Technical startups, software developers, product managers, and lean engineering teams |
| Core Capabilities | Visual Query Builder, Direct SQL Editor, Interactive Dashboards, Granular Permissions, Slack/Email Pulses |
| Deployment | Self-Hosted (Docker, Jar, Kubernetes), Metabase Cloud (SaaS) |
| Starting Price | Open-Source version is Free ($0); Metabase Cloud Pro from $85 / user/month (includes 5 users) |
| Payment Frequency | Monthly or Annual billing |
Metabase is widely recognized as one of the best business intelligence software in 2027 for fast-moving startups and engineering-led organizations that want transparent, straightforward analytics without enterprise bloat. Available as an open-source tool, Metabase can be deployed in minutes via a single Docker container, connecting directly to PostgreSQL, MySQL, Snowflake, BigQuery, and MongoDB databases.
The platform provides a dual interface: a visual query builder that lets non-technical team members filter and aggregate data without writing code, and a native SQL editor for developers running complex analytical scripts. Dashboards can be shared via automated Slack updates or embedded into web applications using JWT authentication. For teams wanting full control over their code and data, Metabase offers a flexible, lightweight solution.
Key Features
- Open-Source Core: Fully free self-hosted edition with direct access to code, community plugins, and self-managed security.
- Visual Query Builder: Empowers non-technical staff to answer ad-hoc questions without writing raw SQL.
- SQL Query Interface: Fast, feature-rich SQL editor with auto-completion, query variables, and data snippets.
- Scheduled Pulses & Alerts: Sends automated dashboard snapshots to Slack channels and email lists based on schedules or thresholds.
- Simple Embedding: Easy-to-use iframe and SDK options to embed clean interactive charts into customer web portals.
Pricing
- Open Source: Free ($0 self-hosted community edition with core querying, visualization, and dashboard features).
- Pro (Cloud or Self-Hosted): $85 / month (includes 5 users; $5 / additional user/month; SSO, row-level permissions, auditing).
- Enterprise: Custom quote (dedicated account management, priority technical support, white-labeling, and advanced governance).
10. Sigma Computing — Best Cloud Analytics Platform with Familiar Spreadsheet Workflows
Company Overview
| Detail | Information |
| Founded | 2014 |
| Headquarter | United States (San Francisco, California) |
| Service Type | Cloud Data Warehouse BI & Spreadsheet-Native Analytics |
| Target Market | Mid-market to enterprise organizations using modern cloud warehouses (Snowflake, Databricks, BigQuery) |
| Core Capabilities | Spreadsheet Interface, Live Warehouse Compute, Visual Data Lineage, Collaborative Workbooks, Write-Back |
| Deployment | Cloud-based SaaS |
| Starting Price | Custom quote tailored to user scale and cloud warehouse architecture |
| Payment Frequency | Annual subscription |
Sigma Computing is widely recognized as one of the best business intelligence software in 2027 for finance teams, business analysts, and operators who prefer the flexibility of spreadsheets over rigid BI dashboards. Instead of forcing business teams to learn complex BI tools, Sigma provides a familiar spreadsheet interface that translates formulas like VLOOKUP and pivot tables directly into optimized, live SQL queries against modern cloud data warehouses.
The platform queries data directly inside Snowflake, Databricks, Google BigQuery, or Amazon Redshift without data size limits or extract delays. Users can analyze billions of live records safely within corporate security boundaries. With support for write-back scenarios such as scenario modeling and budgeting adjustments Sigma bridges the gap between spreadsheet modeling and enterprise data warehouse governance.
Key Features
- Spreadsheet-Native UX: Analyze live data warehouse tables using familiar formulas, pivot tables, and grouping logic.
- Direct Cloud Warehouse Queries: Queries billions of rows in Snowflake and Databricks without extracting or caching data.
- Data Warehouse Write-Back: Input assumptions and forecast adjustments that write back to governed warehouse tables directly.
- Visual Lineage & Governance: Complete tracking of calculations, underlying table sources, and change histories.
- Collaborative Workbooks: Real-time multi-user editing, shared commenting, and dynamic dashboard creation.
Pricing
- Enterprise Platform: Custom quote based on creator and viewer seat allocations, warehouse connectivity, and enterprise security needs.
11. IBM Cognos Analytics — Best for Enterprise-Grade Governance & AI Data Preparation
Company Overview
| Detail | Information |
| Founded | 1969 (Acquired by IBM in 2008) |
| Headquarter | United States (Armonk, New York) |
| Service Type | Enterprise Business Intelligence, AI-Augmented Analytics & Managed Reporting |
| Target Market | Fortune 500 enterprises, healthcare institutions, and heavily regulated public organizations |
| Core Capabilities | AI Data Preparation, Paginated Pixel-Perfect Reporting, Natural Language Assistant, Regulatory Auditing |
| Deployment | IBM Cloud SaaS, Hybrid Cloud, On-Premise, IBM Cloud Pak for Data |
| Starting Price | On-Demand SaaS starting from approximately $10.60 / user/month; Enterprise custom pricing |
| Payment Frequency | Monthly or Annual enterprise contracts |
IBM Cognos Analytics is widely recognized as one of the best business intelligence software in 20276 for large institutions, government agencies, and regulated enterprises that require high-level governance, pixel-perfect paginated reporting, and compliance controls. Cognos excels at managing complex enterprise data architectures, allowing IT teams to enforce strict role-based access rules and automated audit logging across global business divisions.
The platform features an embedded AI assistant that automates data preparation, suggests relevant visualizations, and interprets natural language questions. While modern startups often lean toward lightweight tools, Cognos remains the platform of choice for financial institutions and public utilities that produce millions of scheduled, regulatory-compliant reports every month. Its enterprise resilience and hybrid deployment options deliver rock-solid stability.
Key Features
- Enterprise Managed Reporting: High-volume, pixel-perfect scheduled reports for regulatory, tax, and board disclosures.
- AI Data Preparation: Automated data cleaning, pattern discovery, and semantic relationship mapping.
- Conversational AI Assistant: Ask questions in plain English to receive automated charts, text interpretations, and driver analyses.
- Rigorous Security Architecture: Comprehensive role-based permissions, data lineage auditing, and regulatory compliance frameworks.
- Hybrid Deployment Flexibility: Runs across IBM Cloud, AWS, on-premise servers, or containerized within Red Hat OpenShift.
Pricing
- Cognos Analytics On-Demand: Entry SaaS plans starting around $10.60 / user/month for standard visual reporting.
- Enterprise & Cloud Pak: Custom enterprise quote based on capacity cores, user tiers, and deployment environments.
12. SAP BusinessObjects — Best for Large Multinational Organizations with Legacy SAP ERP Stacks
Company Overview
| Detail | Information |
| Founded | 1990 (Acquired by SAP in 2007) |
| Headquarter | Newtown Square, Pennsylvania, United States |
| Service Type | Enterprise Business Intelligence Suite & Operational Reporting Platform |
| Target Market | Global enterprises, multinational manufacturers, and supply chain operators running SAP ERP |
| Core Capabilities | Web Intelligence (WebI), Crystal Reports, Universe Semantic Layer, SAP S/4HANA Integration |
| Deployment | On-Premise, Private Cloud, Managed SAP Cloud |
| Starting Price | Custom enterprise licensing tailored to ERP user scope and server compute |
| Payment Frequency | Annual enterprise contracts |
SAP BusinessObjects is widely recognized as one of the best business intelligence software in 2027 for global conglomerates, industrial manufacturers, and multinational enterprises whose core business runs on SAP ERP and SAP S/4HANA. The platform is anchored by Web Intelligence (WebI) and Crystal Reports, providing a proven, industrial-strength environment for generating mission-critical operational, transactional, and compliance reports.
Its foundational strength lies in the BusinessObjects Universe layer—a semantic data abstraction that shields business users from complex database structures while enforcing uniform calculation logic across worldwide subsidiaries. While not designed as a lightweight self-service tool, BusinessObjects provides the deep transactional integration, data volume handling, and governance required by organizations with mature SAP investments.
Key Features
- SAP S/4HANA Native Sync: Deep integration with SAP ERP databases, business warehouses (SAP BW), and HANA views.
- BusinessObjects Universe: Enterprise semantic layer that unifies metric calculations across global subsidiaries.
- Web Intelligence (WebI): Powerful ad-hoc reporting and analysis engine for operational business users.
- Crystal Reports: The industry benchmark for creating pixel-perfect, formula-rich transactional invoices and statements.
- Enterprise Governance: Granular security profiles, multi-tier tenant administration, and complete audit tracking.
Pricing
- SAP Enterprise Licensing: Custom enterprise quote structured around named users, concurrent sessions, or server CPU capacity.
13. TIBCO Spotfire — Best for Advanced Statistical Analysis & Streaming Data Science
Company Overview
| Detail | Information |
| Founded | 1996 |
| Headquarter | Boston, Massachusetts, and Palo Alto, California |
| Service Type | Advanced Analytics, Data Science Platform & Streaming Business Intelligence |
| Target Market | Energy companies, pharmaceutical research labs, logistics providers, and quantitative analytics teams |
| Core Capabilities | Embedded R and Python Engines, Real-Time Streaming Data (IoT), Geospatial Analysis, Automated Predictive Modeling |
| Deployment | Cloud SaaS, Private Cloud, On-Premise |
| Starting Price | Custom enterprise quote based on analytic user scale and streaming data volume |
| Payment Frequency | Annual enterprise contracts |
TIBCO Spotfire is widely recognized as one of the best business intelligence software in 2027 for organizations that need more than static historical dashboards, requiring advanced statistical modeling, predictive analytics, and real-time streaming data processing. Widely deployed in oil and gas exploration, clinical pharmaceuticals, semiconductor manufacturing, and logistics, Spotfire combines visual exploratory data discovery with deep mathematical modeling.
The platform features native integration with R, Python, and MATLAB, allowing data scientists to deploy complex machine learning algorithms directly onto interactive dashboards. Unlike traditional BI tools that refresh on scheduled hourly intervals, Spotfire connects to live IoT sensor streams and financial tickers, updating visual metrics in real time. For research-heavy and engineering teams evaluating multi-dimensional variables, Spotfire provides exceptional technical depth.
Key Features
- Real-Time Streaming Analytics: Visualizes high-frequency IoT data and message queues (Kafka, MQTT) as events occur.
- Integrated Data Science: Native execution of Python and R scripts directly within visual dashboard workflows.
- Advanced Geospatial Mapping: Multi-layer GIS mapping capabilities with custom coordinate projections and spatial joins.
- Automated Data Wrangling: Visual data canvas that records every data transformation step for reproducible research.
- Predictive Guided Workflows: Deploy interactive machine learning models that let business users adjust predictive parameters.
Pricing
- Enterprise Analytics: Custom quote tailored to analyst seats, compute node sizing, and real-time streaming connectors.
14. Yellowfin BI — Best for Automated Business Monitoring & Collaborative Storytelling
Company Overview
| Detail | Information |
| Founded | 2003 |
| Headquarter | Australia (Melbourne) |
| Service Type | Automated BI, Business Monitoring & Data Storytelling Platform |
| Target Market | Mid-market businesses, operational teams, and software vendors seeking white-label BI |
| Core Capabilities | Yellowfin Signals (Automated Anomaly Alerts), Yellowfin Stories (Data Storytelling), Guided Natural Language, Embedded Analytics |
| Deployment | Cloud SaaS, Self-Hosted (Cloud/On-Premise) |
| Starting Price | Custom quote based on user tiers and deployment options |
| Payment Frequency | Annual subscription |
Yellowfin BI is widely recognized as one of the best business intelligence software in 2027 for organizations that want their analytics platform to monitor operations proactively rather than waiting for analysts to hunt through static charts. Its standout capability is Yellowfin Signals, an engine that uses machine learning to scan company databases continuously, automatically alerting stakeholders to significant statistical shifts, spikes, or anomalies.
The platform also leads the market in collaborative data storytelling through Yellowfin Stories. This feature allows teams to embed live, interactive charts directly into narrative-style business articles, providing context alongside the numbers. Yellowfin bridges the gap between raw data and executive decision-making, helping teams understand not just what happened, but why it happened and what actions to take.
Key Features
- Yellowfin Signals: Continuous automated background monitoring that alerts users to data shifts without manual searches.
- Yellowfin Stories: Narrative reporting module that embeds interactive live charts into collaborative business documents.
- Guided Natural Language: Guided query interface helping non-technical users build accurate charts without knowing SQL.
- White-Label Embedded BI: Modular components designed for embedding analytics into commercial software apps.
- Actionable Dashboards: Interactive dashboard widgets that allow users to trigger operational tasks directly from reports.
Pricing
- Enterprise & OEM: Custom quote based on deployment type, server capacity, and user counts (Enterprise or Embedded tiers).
15. Amazon QuickSight — Best Serverless Cloud BI Engine for AWS Ecosystem Workflows
Company Overview
| Detail | Information |
| Founded | 2016 |
| Headquarter | United States (Seattle, Washington) |
| Service Type | Serverless Cloud Business Intelligence & Generative AI Analytics |
| Target Market | Cloud-native companies, software developers, and organizations operating in Amazon Web Services (AWS) |
| Core Capabilities | SPICE In-Memory Engine, QuickSight Q (Generative AI), Serverless Auto-Scaling, Pay-Per-Session Pricing |
| Deployment | Cloud SaaS (Native AWS Global Infrastructure) |
| Starting Price | Standard Author from $18 / user/month; Readers from $0.30 / session (capped at $5 / user/month) |
| Payment Frequency | Monthly or Annual billing via AWS Management Console |
Amazon QuickSight is widely recognized as one of the best business intelligence software in 2027 for organizations built on the Amazon Web Services (AWS) ecosystem seeking scalable, cloud-native reporting without infrastructure management headaches. QuickSight operates on a fully serverless architecture that scales automatically from ten users to tens of thousands, eliminating server maintenance, capacity planning, and manual software patching.
Powered by SPICE (Super-fast, Parallel, In-memory Calculation Engine), QuickSight delivers fast query performance across AWS data services like Amazon Redshift, S3 via Athena, Aurora, and RDS. Its QuickSight Q feature uses generative AI to let users ask business questions in natural language and receive instant visual answers. With a unique pay-per-session pricing model for dashboard viewers, QuickSight helps companies roll out analytics to large user bases cost-effectively.
Key Features
- Serverless Architecture: Fully managed cloud BI that auto-scales compute resources with zero infrastructure administration.
- SPICE Engine: High-performance, in-memory calculation engine engineered to accelerate complex visual queries.
- Amazon Q in QuickSight: Generative AI assistant for drafting dashboards, asking plain-language questions, and building executive summaries.
- Pay-Per-Session Viewer Pricing: Reader sessions cost $0.30 each and cap at $5/month, keeping enterprise costs predictable.
- Deep AWS Integration: Frictionless single-pane connectivity to Amazon Redshift, Athena, S3, RDS, and AWS IAM roles.
Pricing
- Standard Author: $18 / user/month billed annually ($24 billed monthly; report design, dashboard publishing).
- Enterprise Author: $24 / user/month billed annually ($28 billed monthly; includes encryption, SPICE capacity, and compliance).
- Enterprise Reader (Pay-Per-Session): $0.30 per 30-minute session, capped at a maximum of $5 / reader/month.
- Amazon Q Add-On: Available as an enterprise capacity add-on for generative AI features.
Best Business Intelligence Software in 2027 Compared
| Platform | Best For | Deployment | Key Capabilities | Starting Price |
| Microsoft Power BI | Microsoft 365 ecosystem & self-service | Cloud SaaS (Azure), On-Premise | DAX modeling, Copilot AI, 150+ connectors | Free Desktop; Pro from $14/user/mo |
| Tableau | Visual storytelling & exploratory analytics | Cloud SaaS, On-Premise | VizQL engine, Einstein AI, Prep Builder | Viewers from $15/user/mo; Creator $75/mo |
| Looker | Semantic modeling & Google Cloud | Google Cloud SaaS, Multi-Cloud | LookML semantic layer, BigQuery native sync | Custom enterprise quote |
| Qlik Sense | Associative multi-source exploration | Qlik Cloud SaaS, Hybrid | Associative engine, Insight Advisor AI | Standard from $825/mo |
| ThoughtSpot | Natural language search analytics | Cloud SaaS, Embedded | ThoughtSpot Sage (LLM), SpotIQ anomaly alerts | Team tier from $95/user/mo |
| Domo | Rapid cloud ingestion & mobile dashboards | Cloud SaaS, Multi-Cloud | 1,000+ connectors, Magic ETL, Domo.AI | Consumption / credit-based pricing |
| Sisense | Embedded analytics in software products | Cloud SaaS, Linux / K8s | Developer SDKs, In-Chip engine, white-label | Custom OEM enterprise quote |
| Zoho Analytics | Affordable BI for growing SMBs | Cloud SaaS, On-Premise | Zia AI assistant, auto data blending | Basic from $24/mo (2 users) |
| Metabase | Open-source & developer simplicity | Self-Hosted (Docker), Cloud | Visual query builder, SQL editor, Slack alerts | Open Source Free ($0); Pro $85/mo |
| Sigma Computing | Spreadsheet interface on cloud warehouses | Cloud SaaS | Live warehouse compute, write-back, formulas | Custom enterprise quote |
| IBM Cognos Analytics | Enterprise governance & managed reports | IBM Cloud, Hybrid, On-Premise | Pixel-perfect reporting, AI data preparation | SaaS from ~$10.60/user/mo |
| SAP BusinessObjects | Multinationals with core SAP ERP | On-Premise, Private Cloud | WebI, Crystal Reports, Universe semantic layer | Custom enterprise quote |
| TIBCO Spotfire | Statistical modeling & streaming IoT data | Cloud SaaS, On-Premise | Embedded R/Python, real-time message streams | Custom enterprise quote |
| Yellowfin BI | Automated business monitoring & alerts | Cloud SaaS, Self-Hosted | Yellowfin Signals, Stories narrative reports | Custom enterprise quote |
| Amazon QuickSight | Serverless BI in the AWS ecosystem | Native AWS Cloud SaaS | SPICE engine, Amazon Q, pay-per-session | Authors from $18/user/mo; Readers $0.30/session |
Frequently Asked Questions (FAQs)
What is the most popular business intelligence software in 2027?
Microsoft Power BI remains the most widely adopted platform due to its seamless integration with Microsoft 365, Teams, and Azure, alongside accessible per-user pricing. For organizations with dedicated data visualization teams and advanced visual storytelling needs, Tableau continues to hold dominant enterprise market share.
Can non-technical users build reports without knowing SQL?
Yes. Modern self-service BI platforms offer drag-and-drop visual report builders, spreadsheet-like interfaces (such as Sigma Computing), and natural language search engines (such as ThoughtSpot and Power BI Copilot) that allow non-technical business users to query data and build dashboards without writing code.
What is the difference between a semantic layer and a standard BI dashboard?
A standard BI dashboard visualizes queries built directly on tables, which can lead to conflicting metric definitions across departments. A semantic layer (such as Looker’s LookML or SAP’s Universe) centralizes business logic, data definitions, and KPIs into a single governed model, ensuring every department calculates critical numbers like revenue and churn identically.
How much does business intelligence software typically cost?
Costs vary by deployment architecture. Lightweight and SMB tools (like Zoho Analytics or Metabase Pro) start between $24 and $85 per month. Mid-tier platforms typically charge $14 to $75 per user per month. Enterprise deployments utilizing warehouse capacity, serverless compute (like Amazon QuickSight), or regulated governance (like IBM Cognos or SAP) typically operate on custom annual contracts ranging from several thousand to tens of thousands of dollars.
Do organizations need a dedicated data warehouse before using BI software?
Not necessarily. While high-performance platforms like Looker, Sigma, and ThoughtSpot perform best when querying centralized cloud data warehouses (such as Snowflake, BigQuery, or Databricks), all-in-one platforms like Domo, Zoho Analytics, and Power BI include built-in ETL engines capable of ingesting data directly from raw spreadsheets, transactional databases, and SaaS APIs.
Conclusion
Choosing the right Business Intelligence (BI) software in 2027 comes down to matching your existing technical stack, data governance needs, and team capabilities. Organizations heavily invested in Microsoft or Google Cloud environments will find smooth integration and high ROI in Microsoft Power BI or Looker. Teams seeking pure visual analytics and exploratory power will continue to find Tableau and Qlik Sense top-in-class.
For engineering-led teams and tech startups, lightweight or open-source solutions like Metabase eliminate complex setup times, while Sigma Computing offers the ideal bridge for users who want spreadsheet workflows over cloud data warehouses. By identifying whether your team requires self-service ease, developer-grade embedded analytics, or enterprise-wide regulatory governance, you can select the BI platform that turns your data into clear operational decisions.
